Infrastructure Observability.
Monitoring for Frostmourne, my local AI infrastructure platform, using Telegraf, InfluxDB, and Grafana.
Overview
Frostmourne is my local AI infrastructure platform, built on Ubuntu Server with Docker, GPU-pinned Ollama instances, and dedicated workloads for AI assistance and coding.
The monitoring pipeline uses Telegraf to collect hardware and operating-system metrics, InfluxDB to store that time-series data, and Grafana to query and present it through dashboards.
This makes it possible to compare Frostmourne at idle with concurrent AI workloads across CPU utilization and package temperature; GPU utilization, temperature, and power draw; RAM utilization and temperature; Ethernet PHY temperature; system temperature; and NVMe temperature.
Dashboard
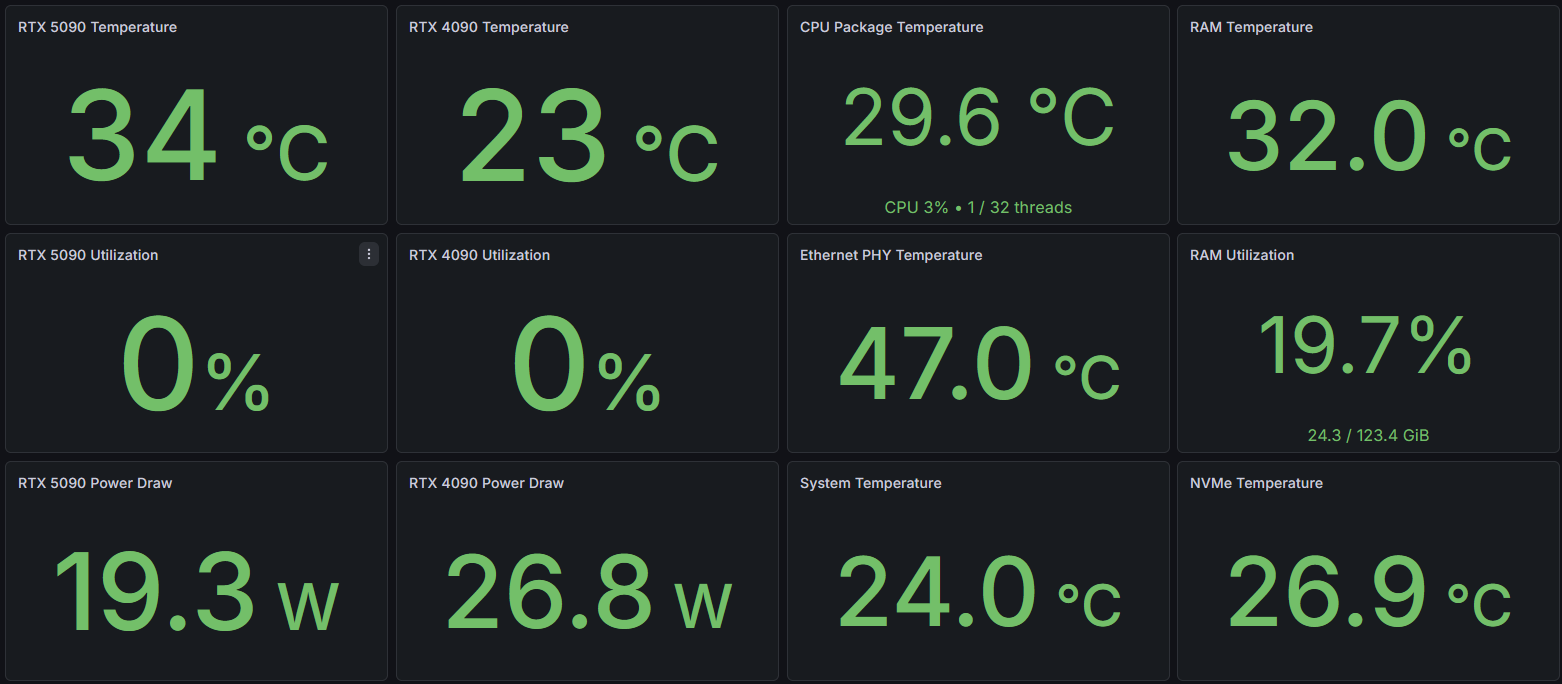
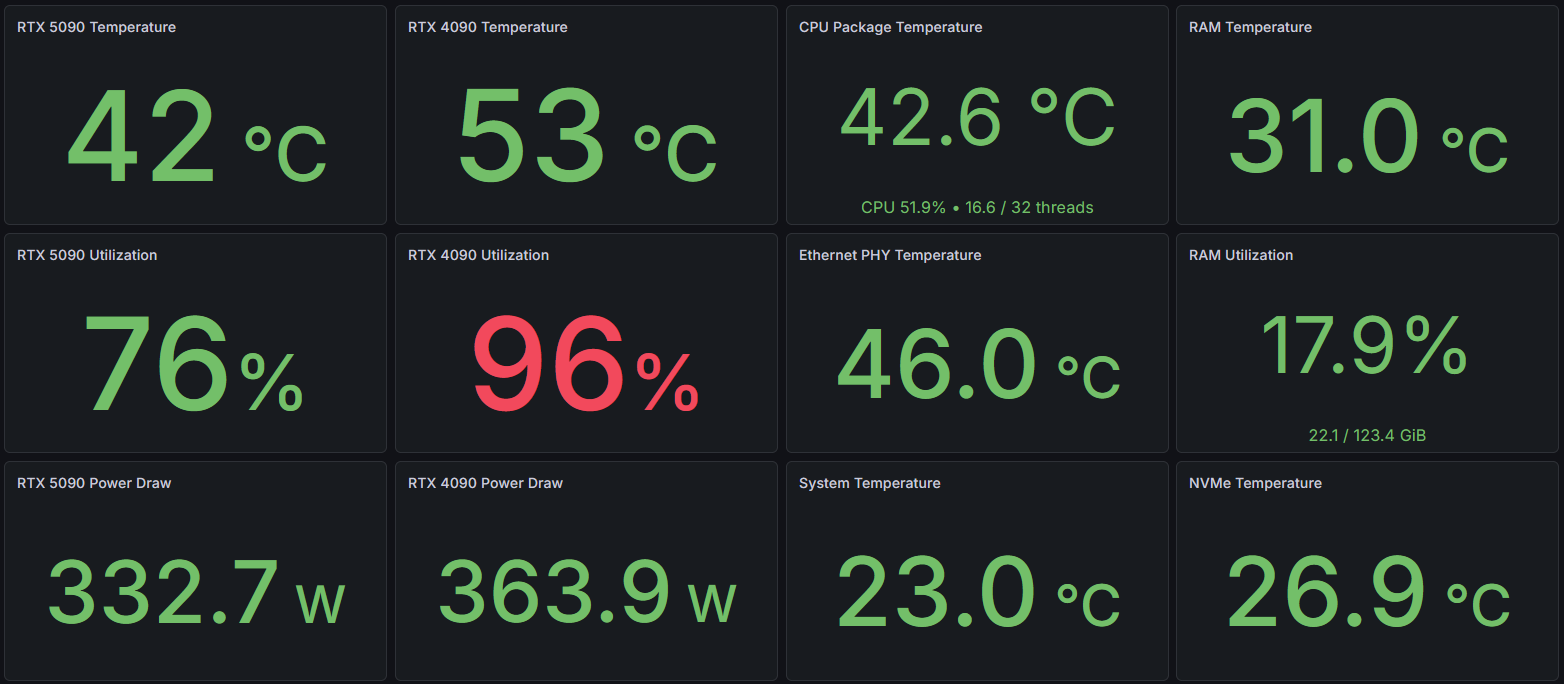
These recorded Grafana screenshots show Frostmourne first at idle, then under concurrent AI workloads. They are point-in-time captures rather than live telemetry or a controlled benchmark. Ambient air temperature was approximately 18–19 °C, providing environmental context for the component readings.
Idle state
Concurrent coding and troubleshooting
Devstral handled a coding task on the RTX 4090 while Gemma processed a troubleshooting request on the RTX 5090.
| Component | Idle | Concurrent tasks |
|---|---|---|
| Utilization | ||
| RTX 5090 | 0% | 76% |
| RTX 4090 | 0% | 96% |
| CPU | 3% | 51.9% |
| Temperature | ||
| RTX 5090 | 34 °C | 42 °C |
| RTX 4090 | 23 °C | 53 °C |
| CPU package | 29.6 °C | 42.6 °C |
| Ambient air (approx.) | 18–19 °C | 18–19 °C |
| GPU power draw | ||
| RTX 5090 | 19.3 W | 332.7 W |
| RTX 4090 | 26.8 W | 363.9 W |
GPU and CPU readings rose during the concurrent tasks. These point-in-time captures show what the dashboard makes visible; they do not establish throughput or sustained thermal behavior.
Current state
Monitoring stack
Telegraf, InfluxDB, and Grafana are part of the existing infrastructure, with GPU telemetry and dashboards.
Public demonstration
Two recorded Grafana views show concurrent coding and troubleshooting workloads alongside an idle state. The portfolio serves local image files without connecting visitors to Grafana.
Architecture
- Frostmourne — infrastructure and GPU telemetry
- Telegraf — metric collection
- InfluxDB — time-series storage
- Grafana — queries and dashboards
Engineering decisions
The demonstration uses recorded screenshots so readers can inspect actual monitoring output without access to the private dashboard.
- Metric selection: The captures include GPU utilization, temperature, and power draw, alongside CPU, RAM, and system sensor readings.
- Collection and retention: Document actual sampling intervals and retention settings before describing their tradeoffs.
- Visitor experience: Show both captures with workload context and a text table of GPU readings.
- Refresh behavior: These images are static and make no polling requests to the monitoring stack.
Public access design
The page displays recorded images, not an interactive connection to Grafana. No Grafana or InfluxDB endpoint, credential, or live query is included in this demonstration.
- The supplied captures show hardware labels and monitoring readings; they contain no visible credentials or private network addresses.
- The images are served as static website assets. Visitors cannot query the underlying data source through them.
- Private monitoring and administrative access remain separate from this page.
- Any future live embed requires a separate review of public data scope and access controls.
Validation & troubleshooting
The captures show reported GPU activity during owner-confirmed concurrent tasks and during an idle state. They demonstrate the dashboard output, rather than a measured benchmark or verification of every metric source.
Validation plan
- Trace a known GPU workload from the source metric to the displayed series.
- Check GPU identity, timestamps, units, and missing-data behavior.
- Verify what a signed-out visitor can query and view.
- Measure dashboard query load at the selected refresh interval.
- Check narrow-screen rendering and the unavailable-dashboard experience.
Build history
Selected milestones in the monitoring project.
- PROJECT MILESTONE
Telemetry foundation
Integrated Telegraf, InfluxDB, and Grafana into the infrastructure.
Established the monitoring stack for collecting and viewing telemetry.
- PROJECT MILESTONE
GPU dashboards
Added GPU telemetry and dashboards for Frostmourne.
Made GPU behavior visible alongside the inference workloads.
- LOCAL PORTFOLIO WORK
A dedicated observability case study
Separated the monitoring project into its own page and added recorded workload and idle-state captures.
Demonstrates GPU monitoring with real workload context while keeping live monitoring access private.